Demo Dashboard
Take a peek at the insights you’ll unlock with ML Mind. These sample charts represent the types of visualisations available in your personalised dashboard.
Dashboard Highlights
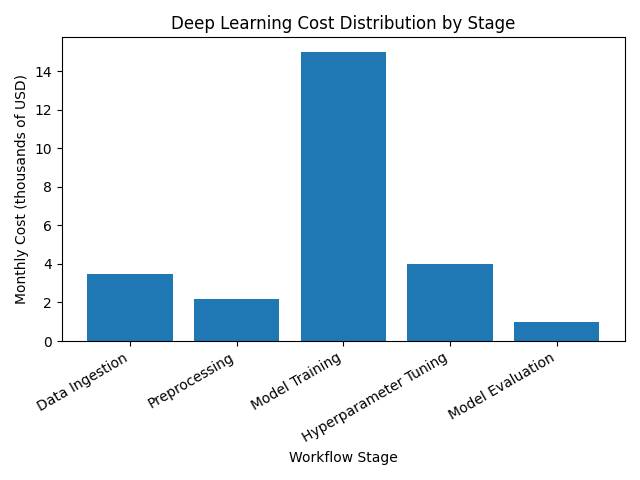
Cost distribution across your ML pipeline stages
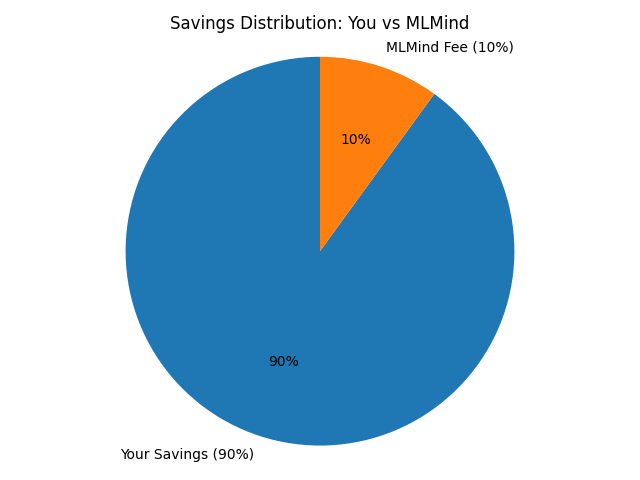
Savings split between you (90%) and ML Mind (10%) after optimisation
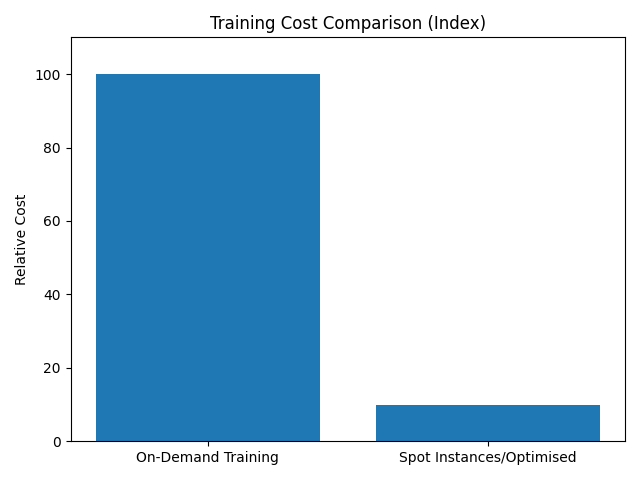
Training cost savings via GPU sharing and right‑sizing
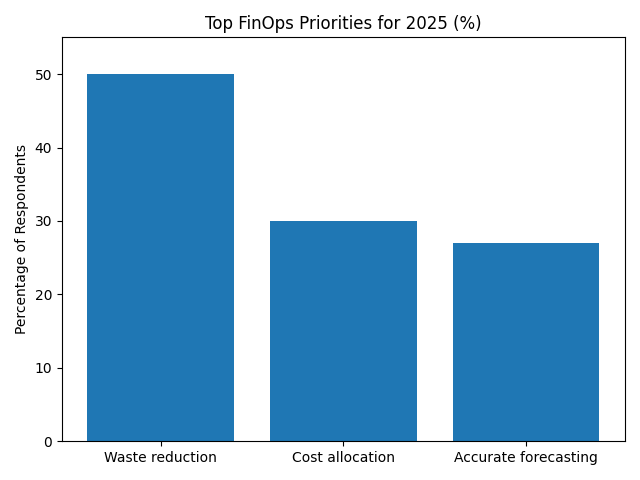
Top FinOps priorities for 2025 as reported by practitioners
What You’ll See
Your ML Mind dashboard includes several pages. The Overview summarises total spend, estimated waste and savings achieved. The Pipelines page drills into each experiment’s cost, GPU hours and waste ratio, with health indicators to highlight problem pipelines. The Findings page lists root causes with confidence scores, cost impact and recommendations. Guard Control lets you configure warning, stop and block modes, while Reports compare costs before and after optimisation over daily, weekly and monthly intervals. Together these insights empower your team to act swiftly and maximise ROI.